Results Summary
The Results Summary form (study > Volumetrics > Volumetric Study > Results Summary) shows the status and results of the volumetric calculations that you initialized with the previous step of the workflow, Run Study. At the top of the Results Summary form, select the Study of interest. On the left side of the form, under Design Status, you can find the list of designs included in the volumetric study. The Realizations Results Summary on the right side lists all the realizations for the selected design with each row showing the input parameters and distribution of volumes per realization.
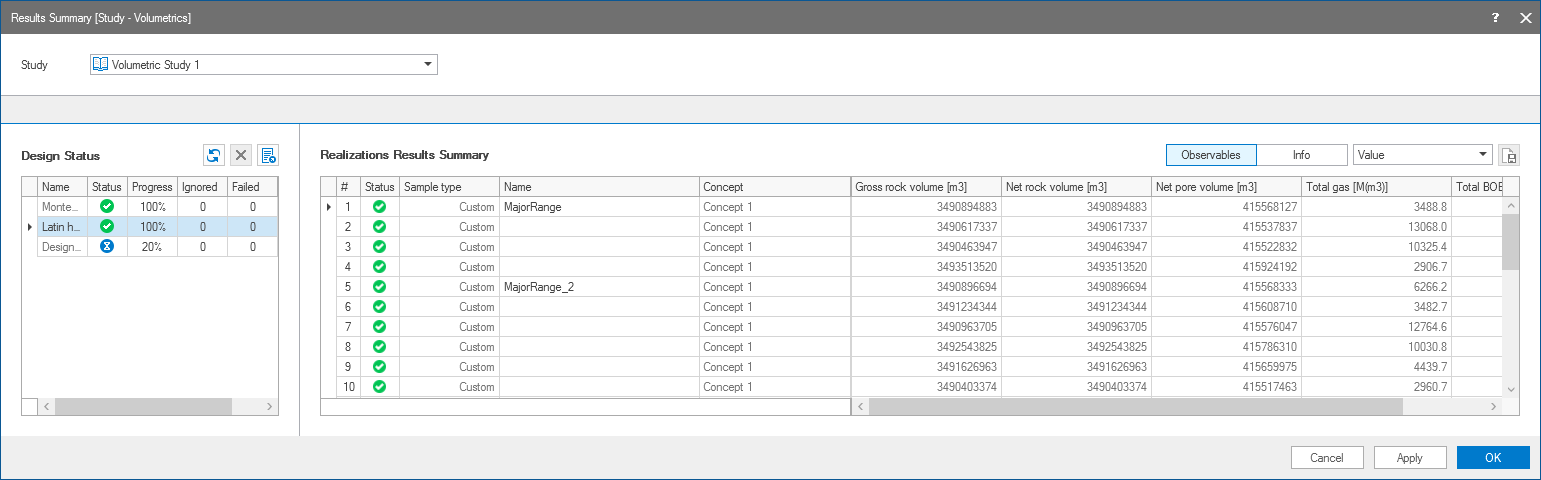
The Results Summary form with the run status of various designs and the results summary of realizations. click to enlarge
Design status
Every volumetric study has one or more designs that are listed on the left side of the form, with the name of design, current status and its progress in percentage. Each design may have multiple realizations per concept, depending on the uncertainty parameters selected on the Designs form of the Volumetrics Study workflow. To see an overview of all the information related to a specific design, such as the used concept, sample type, number of realizations etc., right mouse click anywhere in the row of a design to open the context menu and select Info. Once the realization run has finished, the overview updates with additional data related to the execution process. The designs are run from top to bottom as submitted on the Run Study form. In the 'Status' column, the hourglass icon  indicates that the calculations are in progress whereas the green check mark
  shows the design calculations are completed. Use the abort icon
  to stop an ongoing design calculation.
The 'Progress' column shows the progress of calculations for each design in percentage. JewelSuite checks for updates every 5 seconds on the progress status and results of completed realizations.
The 'Ignored' column lists the number of realizations that are set to ignored. You do this manually in the Realizations Results Summary. Right mouse click anywhere in the row(s) with the realization you want to ignore the results off, and select the context menu option Ignore result(s). When a realization is ignored, it is removed from all the combined statistics, and is not included in the Analyze Results View. If you want to include the results again, open the context menu once more and select Enable result(s).
The 'Failed' column lists the number of failed realizations. If a realization fails, it is indicated with a failed icon ![]() in the Realizations Results Summary as well. You can use the context menu to rerun all failed realizations. To do, right mouse click anywhere in the column with failed realizations, and select Rerun all failed realizations.
in the Realizations Results Summary as well. You can use the context menu to rerun all failed realizations. To do, right mouse click anywhere in the column with failed realizations, and select Rerun all failed realizations.
The 'Scheduler' column (you can use the scroll bar below the table to see more columns) shows the execution platform that was used to run your study.
The Output Information pane (Workspace > Panes) logs all the errors, warnings and information messages.
Icons above the Design Status table:
![]() Refresh To get the latest updates and results for the designs in the study.
Refresh To get the latest updates and results for the designs in the study.
 Abort To stop an ongoing design calculation.
 Export as CSV To export the results per design as a .csv file. From the 'Export to...' dialog opens, save the .csv file at the preferred location. For more information about the volume breakdown in .csv files, see Volume breakdown in the .csv file.
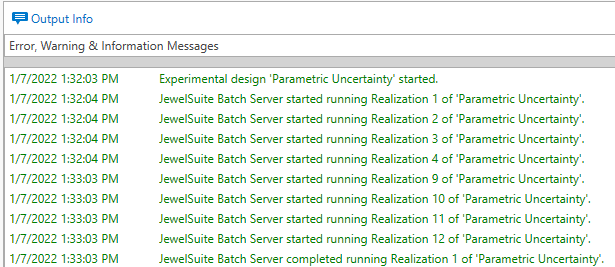
The current status of the realization runs, executed by the BatchServer, is continuously updated in the Output Information pane (Workspace > Panes). Each time a realization is completed, the results table is updated automatically. click to enlarge
To analyze your results
Select the design of interest, under Design Status, and scroll in the Realizations Results Summary table to review the break down of volumes. By default the Observables option is selected to display the volumes of the defined observables on the Results table. To show information related to the run of the realizations of a volumetric study, such as the run status or the execution time, click on the Info button.
If the results are exported as a .csv file, each realization is broken down into smaller volumes defined by the property classes of the selected 'Regions' on the Define Observables form. Optionally, if you selected a boundary on the same form, each reported volume is broken down once more into the volume inside and the volume outside of the boundary.
Results table - rows
Each row represents a realization of volumetric concept for the particular design.
Results table - columns
Realization Info Depending on the selected design you find the following columns:
- # - Shows the realization number.
- Status - Shows whether a realization was successfully executed
 , failed
  or set to ignored
  . When a realization failed, there is only one output row for that realization and there is no further volume break-down in the .csv file. Hover the mouse over the icon of failed realization to know the error.
 - Sample type - (Only for Adhoc and Latin hypercube) Shows the type of sampling for Ad hoc and Latin hypercube designs. This includes min, max, reference, most likely and custom.
- Name - (Only for Adhoc and Latin Hypercube) Optionally type a name in the Name field and click on Apply. The name should be unique per realization. When you add a name, the realization will be highlighted on the CCDF curve in the Analyze Results View.
- Concept - Shows the name of the volumetric concept.
Results Based on whether you selected Observables or Info, this section shows the corresponding information:
Observables The Results section shows the total volume output of the volumetric calculation for the selected observables. You can ignore results of realizations. You do this manually in the Realizations Results Summary. Right mouse click anywhere in the row(s) with the realization you want to ignore the results off, and select the context menu option Ignore result(s). When a realization is ignored, it is removed from all the combined statistics, and is not included in the Analyze Results View. If you want to include the results again, open the context menu once more and select Enable result(s).
Info The Results section shows additional data related to the execution of the realizations for a selected design.
- Exit error Number indicating whether a realization run successfully (0) or not (any number except 0).
- Started on Start date and time of execution.
- Finished on Finish date and time of execution.
- Execution time Running time including starting up the BatchServer, loading the solution, running the realizations, and closing the solution.
- Json Id Identifier with which you can locate the results file on the hard drive (C:\Users\ [user name] \AppData\Local\Baker Hughes\StudyResults).
You can rank an observable of your choice based on its percentiles. This way you can easily recognize for example the P90, P50 and P10 realizations of a particular observable and optionally re-run and save this realization as a new solution, see Re-running and saving a single realization. You can rank the percentiles of an observable for all concepts combined (in case you have multiple) or per individual concept.
To do this:
- Select Percentile all concepts or Percentile per concept from the button located above the Results table, see image below.
- Click in the column header of the observable of interest to sort the table based on the observable's percentiles (each next click sorts the column ascending or descending). Alternatively you can use the column header's context menu and select 'Sort Ascending' or 'Sort Descending'. A little black arrow in the column header indicates that the table has been sorted based on this column.
- (Only when you selected Percentile per concept) Remove all unwanted concepts from the table by filtering on the concept of interest. To do this, hover over the column header of the 'Concept' column, click on the filter icon that appears and select the concept of interest from the filter menu. The table now shows only the concept of interest, with the sorting as applied in step 2.
- In the column of the observable of interest (the one that you sorted), you can now scroll to the percentile of interest. For example, the P90 realization for the observable is the realization where the percentile number is (close to) 90% (or 0.90).
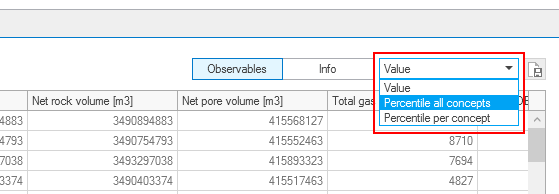
Show the observable's percentiles by selecting one of the 'percentile' options. click to enlarge
Conceptual uncertainty
Conceptual uncertainty, as assigned to volumetric concepts in the form of weight factors on the Concept View, is incorporated in the run results via the number of realizations per volumetric concept, however, only when 'Latin Hypercube' was selected as sampling method on the Designs form. For example, Concept A with a probability of 10% and Concept B with a probability of 90% will generate nine times as many realizations for Concept B as for Concept A. This way, conceptual uncertainty is incorporated in the average of all realizations.
Saving results
To save your results, either Export as CSV with the  icon above the Design Status table, or save your solution. Note that the run results will be lost, unless you save your solution. Upon clicking the Export as CSV icon, a dialog opens where you can select the designs for which you want to export the results.
- Under 'Regions' it will show 'Region 1' and in cells in that column the names of the property classes to which the total volume has been broken down, based on your selections on the Define Observables form. Columns 'Region 2' and 'Region 3' are not listed (no property class name is shown) either when these regions were not selected, or when the property class for the selected discrete property (as selected on the Define Observables form) is not present for the 3D grid used in the volumetric concept. See Defining observables for more on selecting Region 1, 2 and 3.
- Column 'Boundary' is populated when it was selected on the Define Observables form. It indicates whether the (broken down) volume falls inside or outside the boundary (e.g. lease area boundary).
- The next columns contain the results of the volumetric calculation, as defined on the Define Observables form (e.g. Bulk Volume, Net Volume, Pore Volume, etc.)
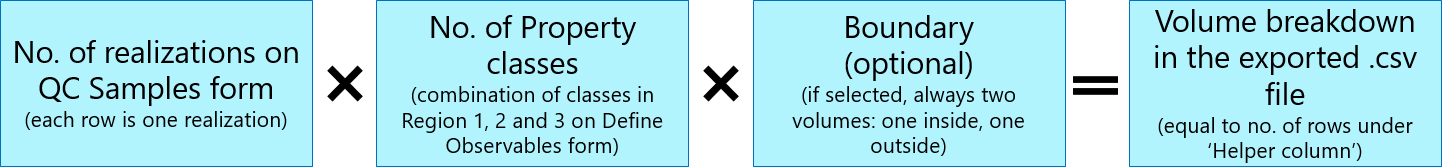
The volume breakdown in the .csv file is reported as follows:
The image below shows the elements defining the volume break-down.
Simplified example of a volume break-down:
- Assume you have one Volumetric Concept with three realizations, i.e. three rows in the table on the QC Samples form. This situation is typical if you have one uncertainty parameter (no seed) and you sampled with Tornado. The number of realizations on the QC Samples form is 3, i.e. the volume break-down in terms of realizations is 3.
- On the Define Observables form, assume you selected a property type that contains three property classes (e.g. 'Zone-A', 'Zone-B', 'Zone-C'). The volume break-down in terms of Property Classes is 3.
- On the Define Observables form, assume you selected a boundary (e.g. license/lease boundary). The volume break-down in terms of using a boundary is 2.
- The total number of broken down volumes in the (exported) .cvs file is 3 realizations x 3 property classes x 2 (in- and outside boundary) = 18.
Re-running and saving a single realization
You can re-run and save a realization of your choice, e.g. the P10, P50 or P90. You do this by picking a realization from the Realizations Results Summary table. To see the percentiles and easily pick your P90, P50 or P10 realization, see Percentile ranking above. 'Re-running and saving a realization' means a new solution is created with the samples corresponding to the realization (as listed on the QC Samples form) auto-filled as 'reference value' on all the active uncertainty parameter's workflow forms. The new solution is then automatically run with these values, and saved under a new name.
In this new solution (called the 'saved realization' hereafter) you can investigate the effect of the sampled values, e.g. if you specified 'depth and thickness uncertainty', the applied depth shift. Or if you specified rock property modeling uncertainty, the used simulation seed.
To re-run and save a single realization:
- Click on a row in the Realizations Results Summary table to select the realization of your choice.
- Click the Re-run and save single realization icon (
 ) icon at the top-right of the table.
 - The Save As dialog opens with the save location of the current solution and an auto-generated name with the following name convention: <name of current solution>_<design name>_R<realization number> (you can change it if you want).
- Click Save. Click Cancel on the Results Summary form to close the form.
- When the application has finished running the realization, you find it in the location you specified under step 3.
Special notes on the 'saved realization'
Facies modeling
The values in the table on the Results Summary form are the target fractions as picked by the sampling method. These values are not normalized. They are, however, normalized when the study is run. Therefore, in the 'saved realization', you find the normalized fractions filled in the Facies Modeling > Trends & Proportions form.
Depth and Thickness Uncertainty
Depth and thickness uncertainty (model > 3D Structure > Depth and Thickness Uncertainty) is implicit, which means the horizon surfaces of the structural model in the 'saved realization' have not physically shifted. Instead, in the JewelExplorer of the 'saved realization' you find the following new and updated data:
- In Surface Sets: A surface set called Explicit Surfaces_Saved Realization_<name of structural model>. It contains the horizon surfaces as tri-meshes, shifted according to the depth shift realization. You can use them as input to a new structural model, see Creating and using explicit surfaces in a (new) structural model.
- In Data > Maps: Shift maps (2D grids) for each shifted surface (i.e. all 'seismic' and 'sub-seismic' surfaces on the Define Uncertainty form, up to and including the selected 'Stratigraphic level') with the name convention: <surface name>ShiftMap. Per shift map the property 'Depth' represents the depth shift.
- In 3D Grids > your grid > Properties > Depth and Thickness Uncertainty folder: Depth shift properties 'Base Shift', 'Top Shift', 'Cell Center Depth', 'Cell Volume' and 'Vertical Cell Thickness'.
- In 3D Grids > your grid > Properties, you find updated fluid model (e.g. 'Cell Volume Oil Leg', 'Height Above Free Water Level') and saturation properties.
A saved realization with depth shift can be used as input to reservoir simulation. The simulation case will use the updated geometric properties (stored in 3D Grids > your grid > Properties) and transmissibility values as input. For more on this, see Using implicit depth uncertainty realizations in dynamic simulation.